Drivers of Vehicles
- Speeding - Especially in school zones
- Running red lights - Not coming to a complete stop at intersections
Welcome to the online meeting for the Metropolitan Planning Organization of Johnson County (MPOJC) Safe Streets and Roads for All Safety Action Plan.
We are excited to share this project with you and look forward to your feedback. Please enter the online meeting and work your way through the pages. You may leave comments or questions at the end.
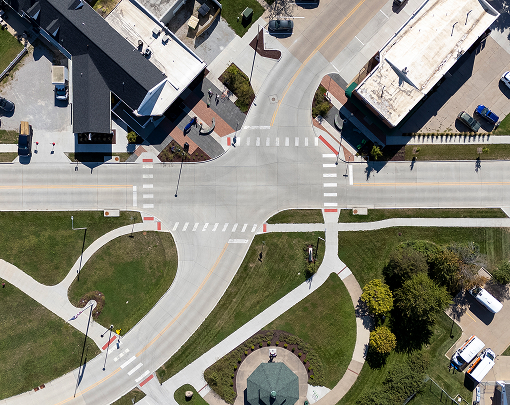
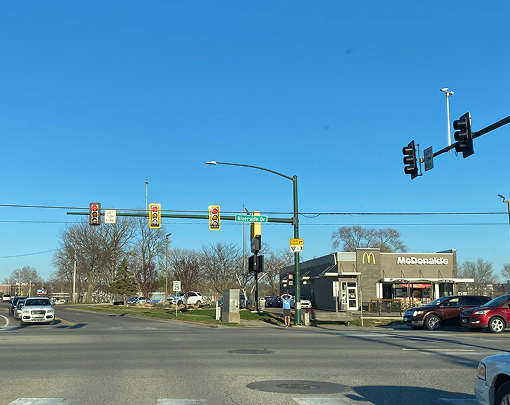
Image: Oakdale Boulevard and Coral Ridge Avenue in Coralville
Click the arrows at the bottom of your screen to visit each section.
Use the navigation bar/menu to revisit any part of the meeting.
Leave your feedback any time on our Comment Form.
This map shows the location of the serious injury and fatal crashes that occurred on metro area roads from 2020-2024. Crashes on Interstate 80, Interstate 380 or U.S. Highway 218 are not included in this study as those roadways are not under local control.
7,746 total crashes in 2020-2024
11 fatalities
105 serious injuries
2 Fatalities
7 Serious Injuries
2 Fatalities
24 Serious Injuries
2 Fatalities
20 Serious Injuries
5 Fatalities
19 Serious Injuries
3 Fatalities
12 Serious Injuries
13.7% of fatal and serious injury crashes involved someone being impaired
2.7% of fatal and serious injury crashes involved someone being distracted
Of all serious injuries or fatalities, 75% involved someone not wearing a seatbelt
Top three major known causes leading to fatality or serious injury crash:
Since this project began in July 2025, MPOJC has coordinated with a Safety Committee of stakeholders, completed data analysis of traffic crashes, and gathered information from residents on their concerns. Review the previous efforts below.
![]() Review the previous efforts
Review the previous efforts
In the fall of 2025, MPOJC published an online survey. Respondents were able to place points on a digital map and provide comments on their safety concerns. In total, 184 people completed the survey and provided 340 points of concern. The comments were shared with engineering staff for each community.
MPOJC also hosted engagement booths at the Iowa City Farmers Market, AfricaFest, and the Healthy Aging Fair to engage in-person with residents about safety concerns. Visitors to the booths were also invited to identify specific locations or general situations that presented safety concerns while traveling in their community.
In January 2026, MPOJC held a safety workshop with a focus on equity concerns, bringing together stakeholders from agencies that represented underserved groups and vulnerable populations.
This public input provided a better understanding of what concerns people have when driving, biking, or walking in the community. Common themes included:
The analysis looked at all public roads within Iowa City, Coralville, North Liberty, Tiffin, and University Heights. Crashes on Interstate 80, Interstate 380 or U.S. Highway 218 are not included in this study as those roadways are under state or federal jurisdiction.
Two models were developed from the safety data analysis.
The Injury Network shows the portion of roads where fatal and injury crashes are overrepresented when compared to where all crashes have happened. Due to the limited number of fatal and serious injury crashes, minor injury crashes were also included but with a lower weight. The Injury Network includes 15% of the roadway length in the study area but covers 77% of fatal and serious injury crash locations. This means that most of these crashes have occurred on a small portion of the overall street network.
The streets identified on the Injury Network have characteristics that are present on other streets where injury crashes have not yet occurred. These characteristics, such as traffic volume, traffic speed, or lack of a median, are known as “risk factors.” Identifying areas with two or more of those common risk factors across the metro area creates the Risk Network. The presence of these factors does not indicate that the roadway is high risk, rather that it may be appropriate to evaluate the roadway speed, visibility, signage, lighting, pavement markings, or other factors to improve safety.
The Priority Network is the result of layering many data points, starting with the Injury Network and Risk Network. The Injury Network and Risk Network together identify the most important locations to address for safety purposes and are used as the base for the Priority Network. Additional factors may also be considered, such as distance to schools, parks, and transit; how vulnerable the population is; if the location is already planned for a construction project; and the public comments from prior engagement. Though all these factors may be included in developing the Priority Network, they may have varying levels of influence on the final network. The project team need your help to determine which factors to use in establishing a priority network.
Review the following factors and select the importance of each.
![]() Review the information
Review the information

The goal of a Safety Action Plan is to guide infrastructure and policy changes that eventually result in zero traffic fatalities or serious injuries.
How will this goal be achieved?
The Safety Action Plan will develop recommendations following the Safe System Approach. The Safe System Approach is based on key principles – including that death and serious injury are unacceptable and that humans make mistakes – and elements that focus on road design, speed, vehicle design, human behavior, and post-crash care.
There are three main types of strategies the Safety Action Plan will recommend.
Let's take a look at how we can use 2020-2024 data from the MPOJC communities to make recommendations about the types of projects that can reduce crashes.
We Know: Non-motorists were in only 3% of all crashes but accounted for 37% of fatal and serious injury crashes.
Where: These types of crashes happened primarily at intersections or mid-block crossings.
Why (Contributing Circumstances): Motorist failed to yield, pedestrian/cyclist made an improper crossing.
![]() Review potential solutions
Review potential solutions
Developing a grade-separated crossing – where people walk or bike over or under a road, eliminating any conflict with vehicles. This type of solution could be applied to a location on the High Priority Network where a lot of people need to walk or bike across a busy roadway.
Making crosswalks more visible with striping, signage, or flashing lights alerts drivers to places where people may be walking across a street. Due to their lower cost and simplicity, these types of improvements can be applied to many crosswalks throughout the urbanized area.
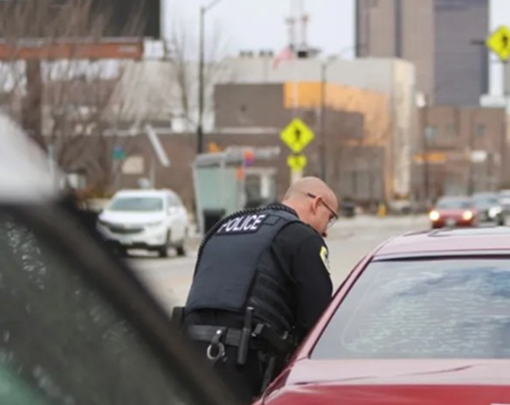
A targeted enforcement effort, such as citing drivers who do not yield to people walking or biking in a crosswalk, can improve motorist awareness and compliance.
Let's take a look at how we can use 2020-2024 data from the MPOJC communities to make recommendations about the types of projects that can reduce crashes.
We Know: Single vehicle crashes are the most common type of crash that leads to a fatal or serious injury to people using all modes – driving, biking, and walking.
Where: More than half of the single-vehicle fatal and serious injury chases happened at an intersection.
Why (Contributing Circumstances): Crashes involving people under the influence, whether walking or driving, are 5 times more likely to result in a fatal or serious injury than crashes involving sober people.
![]() Review potential solutions
Review potential solutions
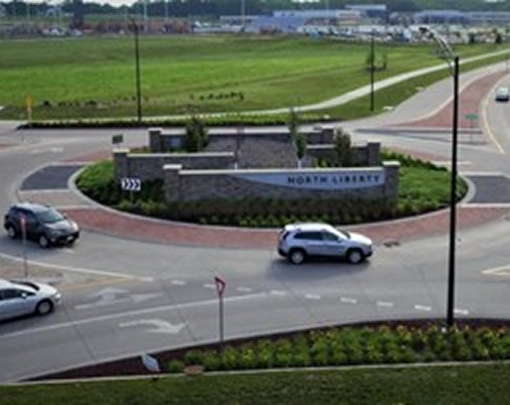
A roundabout or traffic circle limits conflict points between vehicles and reduces the severity of crashes due to lower speeds and the angle of impact.
Retroreflective backplates make traffic signals more obvious to people driving.

Encouraging the use of ride shares, public transportation, or designated drivers will lower the risk of impaired drivers. Working with local transit agencies to offer extended bus service for special events can enable residents to use the bus rather than drive.
MPOJC is continuing to connect with communities through upcoming events in 2026.
MPOJC will use your input to create the final High Priority Network and identify key projects that will improve transportation safety for all modes.
Remarkable Rigs event in North Liberty
MPOJC's Bike Breakfast events
Coralville Asian Festival
Online open house